How far away?
USER DEFINED MAPS
GROUP 2:
Pavan Kumar J V
Suchita Varshneya
Bhagyashree Bohra
INRODUCTION
The goal of the project was to provide a new unconventional map to the user. The motivation was to provide the user with the actual time separation between two points in the maps as opposed to the conventional geographic maps-which simply give the distance.
Such a map would be very useful to a user who is traveling and needs to pick out the shortest path based on time, which may not necessarily be the shortest distance. This discrepancy is due to the fact that we have various modes of transport with various speeds. The map should be intuitive….We try to exploit this information to give the user a more navigable and informative map.
The user provides the Cartesian coordinates of all the locations in the map and the available links with distance in kilometers and its speed (associated with the mode of transportation on that link).
APPROACHES
The map needs to provide the user with the actual route to take between two specified points and not just the time required between any two points. This potentially means a lot of information to be packed into a relatively small viewing area. Keeping these conflicting goals minds, a suitable approach was needed.
One of the topics discussed in class was the representation of the map, whether it should adhere to the actual geography or not. Since the user is just interested in the route between two points, their actual geographic locations seemed unnecessary. On the other hand, since the user is used to a certain “view of the world”, this may do more harm than good, as it may end up confusing the user. We thought the latter argument seemed more reasonable and hence chose not to distort the geography in the match.
The other topic of discussion was the actual map representation: text-based versus graphical. Though the text version offers the benefit of simplicity, we felt that it may be cumbersome to use, especially in case of a large data set and long routes. Hence we chose the graphical approach, which is much tends to easier to use and gives a way to display additional information with help of colors and fonts.
Placing at least 50 cities and 100 links on a letter-size page was definitely a task which required us to think deeply into the process of placing the cities on the page without distorting the geography and yet making the map user friendly. The obvious approach was to get the latitudes and longitudes (corresponding to y-coordinate and x-coordinate in Java) of the cities and scale those to fit the letter page (640 X 480). Our approach was to first shift the co-ordinates closer to the origin and then expand to fit the paper. To implement the same, we found out the smallest values of x and y coordinates and subtracted these values from all of the city co-ordinates. The next operation on these coordinates was magnification as a ratio of the maximum size to the largest coordinates. We worked out a mathematical formula for scaling the cities to be:
Scaled_X = (x –smallest_X + 1.0) * (550/Largest_X)
Scaled_Y = 480 - (y –smallest_Y + 1.0) * (350/Largest_Y)
There were two aspects that are being taken care of-
- It can handle negative coordinates ie lesser than (0,0)
- It can handle coordinates greater than (640,480)
The discussions in class and our general understanding of the problem was leading us to think that with atleast 50 cities, atleast 100 links and labels, the map will be too cluttered and unreadable. Therefore, we thought it would be a better idea to keep only the shortest-time links between all pairs of cities. What this approach did for us was that it removed all the redundant links between the cities that were not giving the shortest-time paths between any two pair of cities.
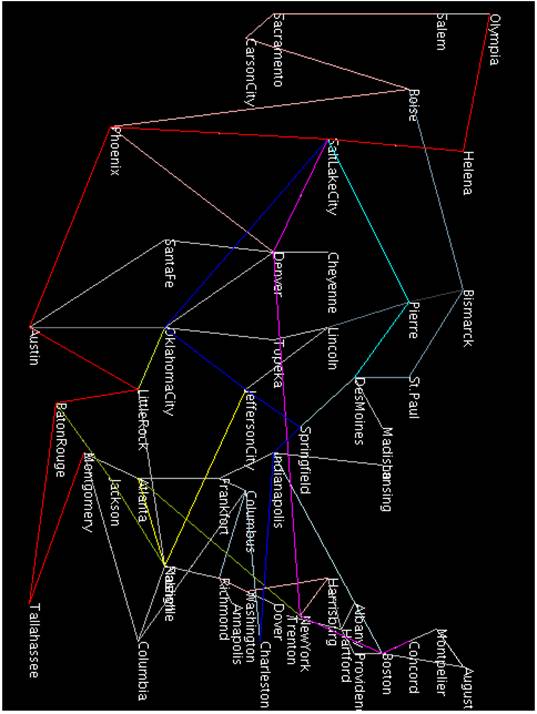
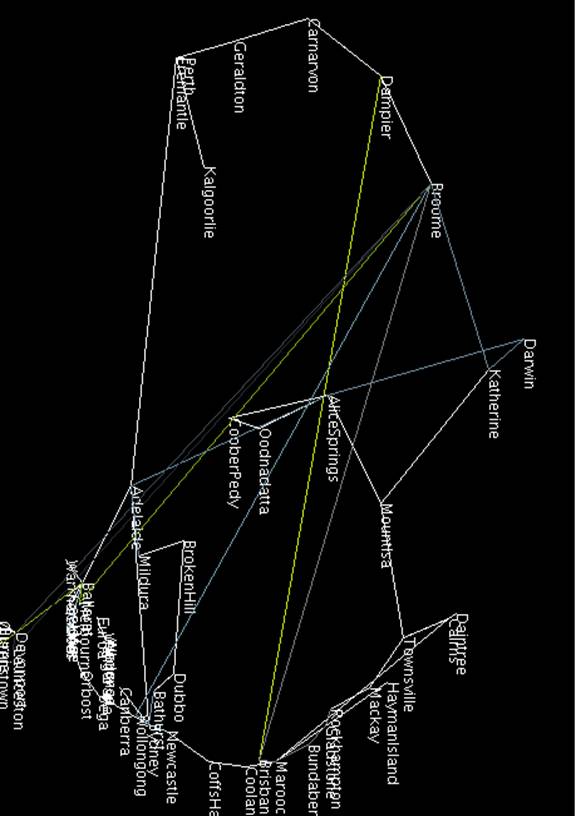
We thought that it would be useful to give the user additional information about the paths rather than just showing the information about the links in terms of whether the links are slow or fast. So, we find out the paths from every city in the map to every other city, and sort these paths based on the time taken to go from one city to another. The idea behind this approach is that the paths connecting the cities which take the longest time will generally pass through more cities than the paths that connect cities separated by lesser time separation. We use a color scheme in which we color the 10 longest shortest paths. The path shows the way to move from any city on the path to any other city on the path just from the color.
We use the Floyd-Warshal algorithm to find the shortest time required to go from one city to another and then to find the path to be taken to reach the destination in the shortest time. If there are two shortest time paths that lead from one city to another, we choose one of the paths arbitrarily. If the direct link between the two cities happens to be the shortest path and there is another path connecting other cities which takes the same time, we remove the shortest link between the cities. The information about the time required is stored in a 2-dimensional matrix, which shows the time required to go from one city to the other. The information about the paths is stored in the form of a path matrix, which shows the next link to follow in order the reach the destination in the path between two cities. We use these two matrices to find the longest shortest path. We iterate through the times matrix and save the paths in an array in the decreasing order of the time taken for the paths. Then we color the 10 longest shortest paths in such a way that none of the paths is a sub-path of the other path.
The
SECRET MAP
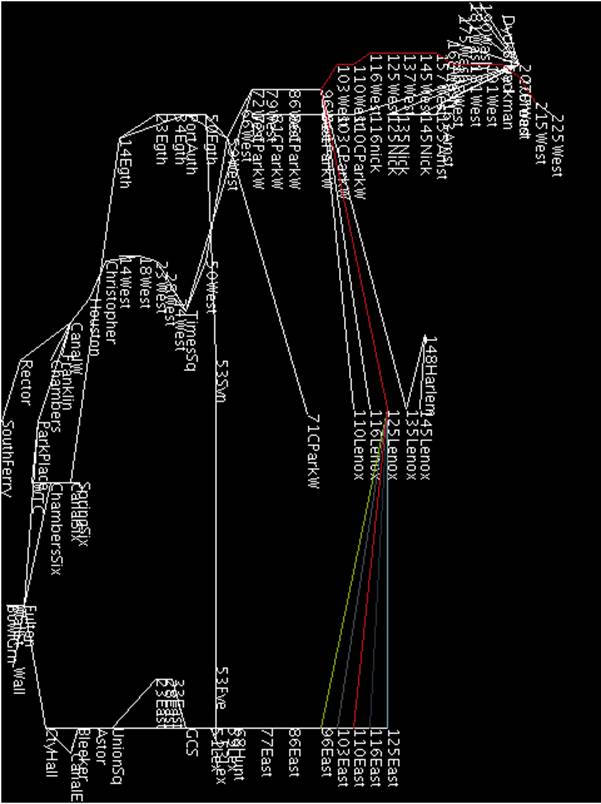
SUBWAY MAP
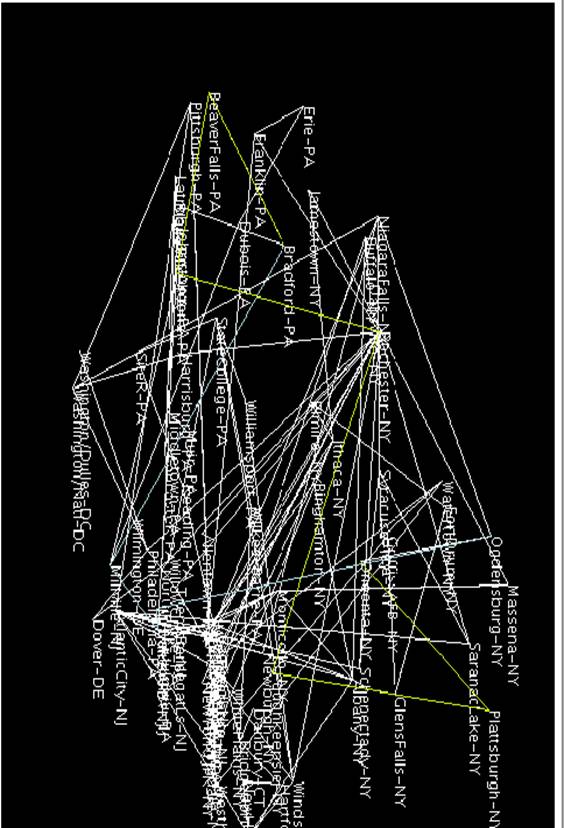
NORTHEAST MAP
TOURNAMENT RESULTS
Archaeologist: 2/4
CS graphics Professor: 2/2
TA: 3/4
Professor: 3/4
In the
tournament, all the judges were able to identify the cities and the correct
shortest path between the cities in the case of both
1. north-east map: Abhinav was not able to find the shortest path between the cities. He could not find the shortest path for any other group.
2. secret map: He was able to find the shortest path between the cities. Seven other groups got the correct shortest paths in this case
3. subways map: He was able to find the shortest path. Only two other groups got the correct shortest paths.
4. US capitals map: He was able to find the shortest path. Six other groups got the correct shortest paths in this case.
CONCLUSION
We conclude that our approach did give beneficial results. It is useful for the user to know the overall shortest paths and it does prove intuitive in quite a few cases. However, since our graphical output wasn’t very refined, we couldn’t “show-off” our functionality as much as we’d have liked to. Though we colored only the 10 longest shortest paths uniquely, they gave enough information to find the paths between many of the cities.
FUTURE WORK
Future work would involve making the graphical display better. We also implemented the functionality for computing the hubs, i.e.: the points with a high number of links. We’d like to use these hubs to make our map more useful. Use of arcs to display multiple paths between two points (instead of over writing) would also make the map more navigable.