SeungJin Nam
Columbia University
sn2119@columbia.edu
This project was conducted to learn about the performance of four different web service architectures, which are PHP, Java Servlet, Connection Pooled Servlet and Apache Axis SOAP. All of the applications were tested in their capability to receive an input parameter from the user, process that and respond to the user with dynamically created content. There were two ways that I have tested against; one is to retrieve only one tuple from the database depending on the input parameter, and the other one is to retrieve 16000 tuples at a time. In addition, I got to test the performance difference between using MyISAM and InnoDB from MySQL.
To conduct my experiment to measure the throughputs and response time using difference web service architectures, the following setup was used.
• Web server: Apache HTTP server version 2.0.54
• Application server : Apache Tomcat version 5.5.16
• PHP Module: for PHP support in Apache web server, PHP version 5.0.4 was installed.
• Database Server: MySQL version 5.0.22. To find the difference between InnoDB and MyISAM, I have created two exact same tables with different engine, one with InnoDB and the other with MyISAM. MyISAM database is a database that is provided by MySQL in default. Query cache was not used in this test; therefore the query_cache_size was set to 0.
• SOAP Server: for SOAP support, Apache Java Axis SOAP implementation version 1.4 was used.
For the hardware description of server machine (honamsun):
Number of CPU |
2 |
Processor Model Name |
Intel(R) Pentium(R) 4 CPU 3.00GHz |
Cache size |
1024kb |
Memory size |
1015448 kb |
Operating System |
Linux Fedora Core release 5 ( Bordeaux ) |
For client machine (clic)
Number of CPU |
1 |
Processor Model Name |
Intel(R) Pentium(R) 4 CPU 3.20GHz |
Cache size |
1024kb |
Memory size |
1026236 kb |
Operating System |
Red Hat Enterprise Linux AS release 4 (Nahant Update 4) |
To measure the web server performance (throughputs and response time) for different web service architectures effectively, I have used httperf version 0.8 in this project. Httperf is a tool for measuring web server performance that is developed by employees at HP. To achieve request throughput of a web server using this tool, one could send requests to the server at a fixed rate and measure the rate at which replies arrive. By running this several times with linearly increased value of request rates, one would see the saturation of the server by looking at the reply rate leveling off, which would be the throughput. This is one of the commands that I ran to measure the throughput of Simpld_db.php.
./httperf ?server honamsun.cs.columbi.edu ?port 80 ?uri /test/Simple_db.php?id=100 ?rate 10 ?num-conn 1800 ?num-call 1 ?timout 60
This command causes httperf to sue the web server on honamsun.cs.columbia.edu running at port 80, and retrieve page /test/Simple_db.php?id=100. It will send 10 requests per second and will send total of 1800 requests; thus result in 180 seconds of measurement. Timeout value here is 60, which means that it is willing to wait only up to 60 seconds for the server to respond. The reply that does not arrive in 60 seconds will be considered as failure.
When the run finishes, it prints out the statistics of the results. Here you can see response time, reply rates, amount of resources used, connection time etc. Two important things that I had to look for was average reply rate and response time. This is the sample output:
Total: connections 1800 requests 1800 replies 1800 test-duration 179.903 s
Connection rate: 10.0 conn/s (99.9 ms/conn, <=11 concurrent connections)
Connection time [ms]: min 1.7 avg 36.7 max 1025.3 median 8.5 stddev 95.5
Connection time [ms]: connect 0.2
Connection length [replies/conn]: 1.000
Request rate: 10.0 req/s (99.9 ms/req)
Request size [B]: 93.0
Reply rate [replies/s]: min 8.2 avg 10.0 max 11.6 stddev 0.4 (35 samples)
Reply time [ms]: response 36.4 transfer 0.0
Reply size [B]: header 181.0 content 187.0 footer 0.0 (total 368.0)
Reply status: 1xx=0 2xx=1800 3xx=0 4xx=0 5xx=0
CPU time [s]: user 40.90 system 136.98 (user 22.7% system 76.1% total 98.9%)
Net I/O: 4.5 KB/s (0.0*10^6 bps)
Errors: total 0 client-timo 0 socket-timo 0 connrefused 0 connreset 0
Errors: fd-unavail 0 addrunavail 0 ftab-full 0 other 0
In order to make fair testing environment, I have set two parameters for httperf command:
• Duration: I have initially set the duration for each run to 5 minutes, which was long enough, but I changed it to 3 minutes because it was taking too long for each run. When you say 5 minutes, it does not take account for the timout periods. Therefore, the time it takes for each run is longer than 5 minutes depending on the performance. I have actually compared the difference of results for 3 minutes test and 5 minutes test, but the throughput was identical. In that line, I decided that testing with 3 minutes duration was enough to get a accurate throughput.
• Timeout: timeout value was set to 60 seconds. I decided that this was long enough to get a response from the server, yet short enough for me to wait until result arrives. I have tried much smaller value such as 5, but it caused some failures even in simple database case (retrieving one tuple); therefore I decided that was not enough. 30 seconds seemed to long enough to; however, sometimes it was not enough for the server to execute many requests to retrieve 16000 tuples in a second.
The first attempt to measure the performance, two client terminals were opened and run against the server. Even with the simple database access case at the rate of 10 requests/s, it could not achieve the average reply rate of 10 replies/s. I kept doing that several times feeling that something was not right, and at last, I figured out that I should not test multiple things at a time in the same client machine. It was because httperf consumes all available CPU cycles of the client machine that there would be not enough resources available for another test. After I stopped testing multiple web service architectures at the same time, I acquired reasonable results.
The other error came from attempting to set the rate too high for the large database access case. As I have done for the simple database access, I have tried to set the initial rate at 10 requests/s. However, when I tried it, the average reply rate came out to be around 0.5 replies/s, and after that the reply rate just became 0. After talking with my mentor (Wonsang Song) and checking the website, I realized that rate of 10 requests/s was too much for the large database access. I fixed the initial rate to 1requests/s, and it started to give me more reasonable results.
In this case, it returned only one tuple from the database depending on the input parameter the user gave. The ‘SELECT' statement used for this operation is:
SELECT * FROM test WHERE id = ‘input parameter'
'id' is the primary key for this table, and; therefore it is unique. When ‘100' is given as input parameter, it would only return one tuple.
Graphs shown below are the performance graphs that are obtained by comparing rates (x-axis) to reply rates (y-axis) which I got from httperf statistics. The point when the rate does not reach the reply rate is the point of saturation; thus throughput.

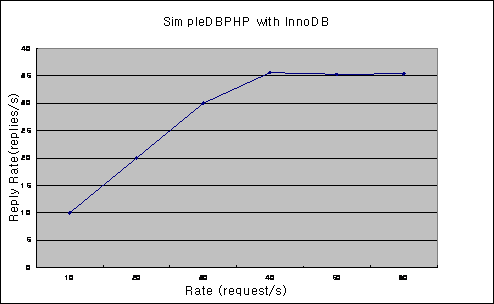
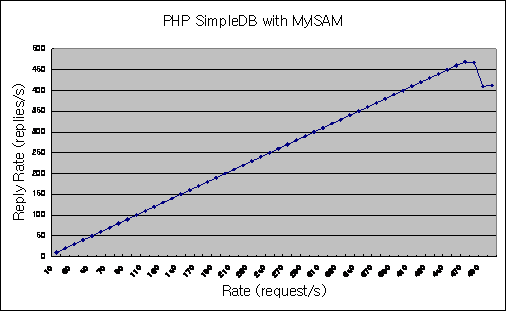
To make a query from the PHP, I used built-in functions of PHP, such as mysql_query(), and no other libraries were used. The first graph is the Simple Database case for PHP with MyISAM whereas second one is the one with InnoDB. The throughput of PHP with MyISAM came out to be 480 requests/s, and with InnoDB it was 30 requests/s. The response time for MyISAM when the rate was 20 requests/s was 10.3 ms whereas in InnoDB case it was 29.7 ms. Comparing throughput you can see that MyISAM performs about 9 times better than InnoDB, and difference in response time also supports that MyISAM performs better than InnoDB.
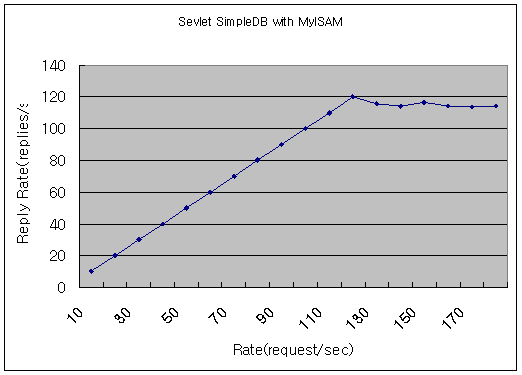
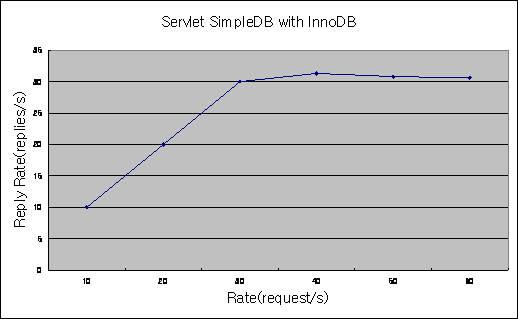
The throughput for the graph on the top is 120 requests/s and for the one on the below is 30 requests/s. Response time for MyISAM was around 10 ms whereas InnoDB was around 30 ms. In this case also, MyISAM performs about 3 times better than InnoDB.
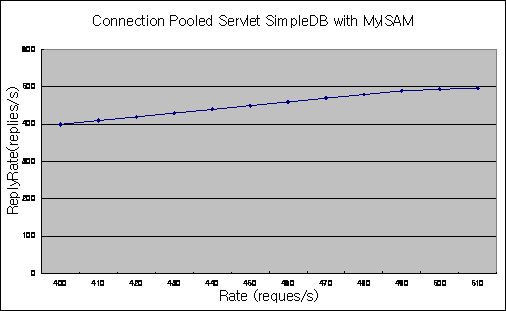
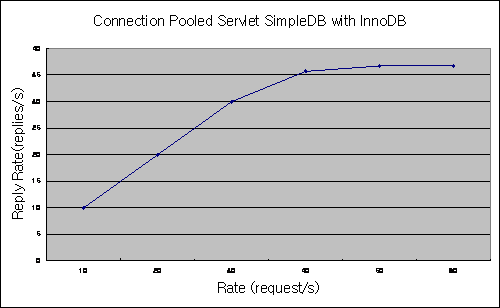
For the first graph on the top (with MyISAM), the throughput is 490 requests/s, although it is not shown well in the graph. It was slowly decreasing, reply rate not reaching the rate, and response time gradually increasing. The response time for connection pooling was very consistent and short; it was only around 1.3 ms, and it was like that until the rate became 480 requests/s when the response time hit the 46.4 ms. Second graph's throughput is 30 requests/s, and response time was around 27 ms. Connection pooling technique performed very well with MyISAM, but does not seem to give any effects for InnoDB.
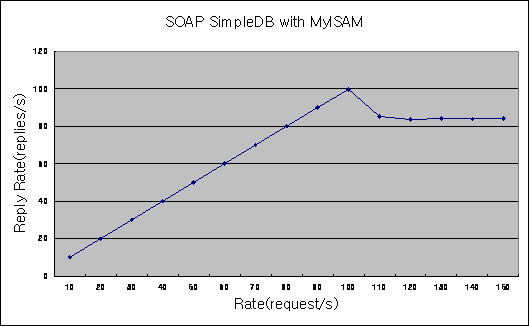

Throughput for SOAP using MyISAM came out to be 100 requests/s, whereas for InnoDB, it came out to be 30 requests/s. SOAP was the one different web services architecture that I used in this project, because it returns XML rather than html. However, it came out to be the slowest among them. The response time was also the largest for both MyISAM and InnoDB ranging from 25 ms to 150 ms for MyISAM and from 50 ms to 210 ms for InnoDB.
|
Throughput (requests/s) |
PHP |
480 |
Java Servlet |
120 |
Connection Pooled Servlet |
490 |
SOAP |
100 |
The highest throughput was achieved by connection pooled Java Servlet. Compared to Java servlet, it is 3.5 times better, and it is actually the best one among the four. Also it had the shortest response time, I think because it was reusing the database connection that they already had, which leaves no need to make new connection and destroy it, thus shortening the process time. It saved a lot of resources on the server because creating a new connection for every client request is an expensive process.
The lowest throughput was 100 requests/s, and it was achieved by SOAP. SOAP returns XML code rather than HTML, and that made it slower than others causing the additional step of generating XML SOAP envelope. Because of this additional step, response time for the SOAP was also the longest.
|
Throughput (requests/s) |
PHP |
30 |
Java Servlet |
30 |
Connection Pooled Servlet |
30 |
SOAP |
30 |
This table indicates the throughputs for different web service architectures with InnoDB rather than MyISAM. InnoDB is another storage engine for MySQL, and it supports the transaction similar to PostgreSQL. It is generally known that MyISAM performs better in operations with simple table whereas InnoDB is better for the people who need transactions. In my case, my table was very simple (no indexes, primary keys, foreign keys etc) and I was only performing simple SELECT Statements, which made the performance of MyISAM significantly faster than InnoDB. According to my results, there is no doubt in my case that MyISAM would be more appropriate than InnoDB. However, strangely enough, throughput for all the web service architectures with InnoDB came out to be identical as 30 requests/s.
For the large database access, I have made it to retrieve 16000 tuples from the database according to the user input parameter. The SELECT statement I used for this operation is:
SELECT nameFirst, nameLast, birthDay, birthYear, birthMonth, weight, height, bats, throws, id FROM test WHERE nameLast like ‘input parameter' order by id
No keys or indexes were used in this operation. As an input parameter, I put ‘sm' which will retrieve all the entries of this table, which adds up to 16000 tuples. Since retrieving 16000 tuples at a time is a large task, the throughputs were very low, and each throughput was not much different between different web service architectures.
The problem I faced measuring the large database access was that after I ran couple of tests, the server went down. I think it is because I have been requesting too many in a short amount of time, and server resource was all used up, and could not recover quickly. Therefore, I had to shutdown every couple of times and restart. In the worst case, I had to wait about 30 minutes to an hour for the server to get back.
Rate (request/s) |
Reply rate (replies/s) |
Response time (ms) |
1 |
1 |
90.2 |
2 |
2 |
91.4 |
3 |
3 |
95.5 |
4 |
4 |
2275.1 |
5 |
3.8 |
26382.9 |
6 |
3.5 |
32228.1 |
7 |
3.5 |
35946.3 |
This table represents the large database access of PHP with MyISAM database engine. Rate is increasing linearly by 1, and reply rate does not reach the rate at “rate 5”, which makes the throughput of 4 requests/s. The response time jumps up to 26382.9 ms from 2275.1 ms when the server is saturated (usually from the saturation point, the response time increases significantly). The first row of this table means that sending 1 request per second, it took 90.2 ms to get response from the server and client got the 1 request back per second.
Rate (request/s) |
Reply rate (replies/s) |
Response time (ms) |
1 |
1 |
118.4 |
2 |
2 |
133.2 |
3 |
3 |
270.7 |
4 |
3.6 |
9677.8 |
This is the case for InnoDB, and the throughput here is 3 requests/s. Comparing response time for MyISAM and InnoDB indicates that it took more time to get response from InnoDB than from MyISAM.
Rate (request/s) |
Reply rate (replies/s) |
Response time (ms) |
1 |
1 |
135.7 |
2 |
2 |
137.2 |
3 |
3 |
186.9 |
4 |
0.4 |
23794.2 |
The throughput for Java Servlet with MyISAM came out to be 3 requests/s. Response time boosted up to 23749.2 ms from 186.9 ms supporting that it is the point of saturation. After the rate of 4 requests/s, it the reply rate crashed to 0 resulting in no replies usually due to time out (meaning that it did not get the response back in 60 seconds (timeout value). In InnoDB case, throughput was 2 requests/s and the response time at rate of 1 requests/s was 124.6 ms, but later at the rate of 3 requests/s increased up to 3883 ms.
Connection pooling was one of the toughest one to test, and the output was bad too. Even with the rate of 1 requests/s, it did not reach the average reply rate of 1, resulting in a throughput of less than 1 requests/s. The main reason for this was that it could not get all the replies within 60 seconds resulting in client timeout error. When I send one request per second for 180 connections, I only got replies from 150 out of them; other 30 was timed out and was not considered in the statistics. Therefore, overall response time was only 40.6 ms, but the reply rate was not good. And it was similar for the InnoDB case.
Rate (request/s) |
Reply rate (replies/s) |
Response time (ms) |
1 |
1 |
693.2 |
2 |
0.1 |
19832.3 |
SOAP was also slow here too. Initial response time was 693.2 ms and it went up to 19832.3 ms when the rate was 2 requests/s, the throughput here.
Throughput for each web service architecture was:
|
Throughput (requests/s) |
PHP |
4 |
Java Servlet |
3 |
Connection Pooled Servlet |
1 |
SOAP |
1 |
In large database access, PHP had the largest throughput whereas connection pooled Java servlet had the lowest. The result is very different for connection pooled Java servlet, which had the best throughput in the simple database access case. It might be because the configuration value that I gave for connection pooling at server.xml was not enough. It crashed the whole server many times, and it might imply that connection pooling techniques consume more resources than other techniques.
However, giving a larger timeout value might result in different throughputs, since the reason why it could not get any better was that they were all caught by 60 seconds waiting periods. I found 60 seconds enough, since it took about 40 to 80 seconds more than expected, waiting for the response, and when I tried it myself, it took only about 3 seconds for each page to load.
The difference between different architectures was not significant, and also with MyISAM and InnoDB, except that it took a little more time for InnoDB to respond. However, still in our database access case, it would be better to use MyISAM rather than InnoDB.
Overall, PHP seems to be the best solution in accessing and performing simple queries to a table. I think mainly because PHP did not have to go through extra application server, whereas others all had to go through tomcat application server. Tomcat server went down frequently when performing the tests, whereas Apache web server never did. In my opinion, that extra step to process application server made a big difference for throughputs and response time. However, connection pooling technique seems to be very powerful; when you compare Java servlet and connection pooled java servlet, connection pooled java is 3.5 times faster, and if connection pooling was on PHP rather than Java servlet, it might have significant amount of improvement in large database access. Also MyISAM seems to be much faster in simple query performance than InnoDB, and the difference in throughput for simple database access was huge (for example, for connection pooled java servlet, throughput was 490 requests/s for MyISAM and 30 requests/s for InnoDB). When the transaction safe environment is not necessary, I think that there is no need to use InnoDB rather than MyISAM.
SOAP had one more step than any other ones to create an XML envelope, and that delayed even more for SOAP. Therefore, overall SOAP was the slowest web service architectures among the ones that I tested. It would not be a good idea to substitute SOAP for the ones that return HTML rather than XML, since performance-wise, SOAP is usually slower than other web service architectures.
In conclusion, I would choose PHP, connection pooled PHP (though it was not tested) as the best web service architecture overall for simple query processes.
From set ups of testing environments to measuring the performance of different web service architectures, I was exposed to so many different things that I was never exposed to. This was my first time setting up Apache Web server and Tomcat server, and to enable these two servers to work with different modules like PHP, SOAP, MySQL and connection pooling, I also had to write and change the configuration for the servers. At the first time, it seemed to be complicated and difficult, but as I went along with more modules, I was getting better. Httperf tool was also very helpful for me to shorten the process of figuring out how to measure the performance, and it was also easy to use. However, I made some mistakes using this tool, as I mentioned at Trial and Error section, and it made me know more about the httperf tool and how it works. Above all, I learned to think about performance of different web services before I build any web pages, and which is appropriate for which functionalities. Before, I never thought about the different web services and how they are different; I just used ones that I knew how to build well. Now I understand that there are different uses for different web service architectures and also for different database engines.
For the future work, since I did not confirm the performance of connection pooled PHP, it would be nice to actually test that and confirm the performance of it. In addition to that, it would be nice to test and compare the performance of SOAP Axis with the other web service architecture that returns XML such as XML-RPC.
1. Michael Lenner, Henning Schulzrinne. Performance and Usability Analysis of Variying Web Service Architectures
2. David Mosberger, Tai Jin. httperf-A Tool for Measuring Web Server Performance, Hewlett-Packard Co.